class: center, middle # Thoughts on an Early Warning System for COVID Infections ### Siva Athreya, Deepayan Sarkar, Rajesh Sundaresan <h1 onclick="document.documentElement.requestFullscreen();" style="cursor: pointer;"> <svg xmlns="http://www.w3.org/2000/svg" width="16" height="16" fill="currentColor" class="bi bi-arrows-fullscreen" viewBox="0 0 16 16"> <path fill-rule="evenodd" d="M5.828 10.172a.5.5 0 0 0-.707 0l-4.096 4.096V11.5a.5.5 0 0 0-1 0v3.975a.5.5 0 0 0 .5.5H4.5a.5.5 0 0 0 0-1H1.732l4.096-4.096a.5.5 0 0 0 0-.707zm4.344 0a.5.5 0 0 1 .707 0l4.096 4.096V11.5a.5.5 0 1 1 1 0v3.975a.5.5 0 0 1-.5.5H11.5a.5.5 0 0 1 0-1h2.768l-4.096-4.096a.5.5 0 0 1 0-.707zm0-4.344a.5.5 0 0 0 .707 0l4.096-4.096V4.5a.5.5 0 1 0 1 0V.525a.5.5 0 0 0-.5-.5H11.5a.5.5 0 0 0 0 1h2.768l-4.096 4.096a.5.5 0 0 0 0 .707zm-4.344 0a.5.5 0 0 1-.707 0L1.025 1.732V4.5a.5.5 0 0 1-1 0V.525a.5.5 0 0 1 .5-.5H4.5a.5.5 0 0 1 0 1H1.732l4.096 4.096a.5.5 0 0 1 0 .707z"/> </svg> </h1> --- layout: true # Background --- <div> $$ \newcommand{\sub}{_} \newcommand{\confirmed}[1]{x(#1)} \newcommand{\active}[1]{a(#1)} \newcommand{\dactive}[1]{a^{\prime}(#1)} \newcommand{\dconfirmed}[1]{x^{\prime}(#1)} \newcommand{\ractive}[1]{\lambda(#1)} \newcommand{\ractivehat}[1]{\hat{\lambda}(#1)} \newcommand{\rconfirmed}[1]{\gamma(#1)} \newcommand{\rincrement}[1]{\rho(#1)} \newcommand{\rinactive}[1]{\mu(#1)} $$ </div> * Goal: looking at current data, predict time to resource scarcity * Motivation: - Strike balance between normal life and adverse health outcomes - Prevent unnecessary economic slowdown (due to restrictions) - Prevent avoidable deaths (due to lack of basic medical facilities) - Obvious strategies: vaccinate, ramp up healthcare facilities - But need to be prepared for surge (new mutations, loss of immunity, unknown factors) - Late reaction leaves lockdown as only solution, cannot prevent deaths --- * Solution: With advance warning, we can deploy graded response - Communicate greater need for precautions and stricter social distancing - Stop mass gatherings - Close markets, cinema halls, gyms, etc. - Lockdown as extreme measure --- * Proposal: - Simple scheme to predict number of active cases - Warning system based on zonewise ability to handle active cases * Input requirements: - Daily number of confirmed / active cases (available from state bulletins) - Critical number of active cases (to be determined policymakers) <!-- - Number of active cases may be approximated, if necessary (e.g., assuming 1% death rate, rest recovered 10 days after confirmation) --> --- layout: true # Model --- - $t$ unit of time (in days) - $\confirmed{t}$ is the total number of confirmed cases upto time $t$ - $\active{t}$ is the total number of active cases upto time $t$ -- - $\ractive{t}$ is the _number of new infections per active infection per unit time_ at time $t$ - __Changes with time__ [this is a very important point] - Depends on many factors: virus strain, social behaviour, vaccination - Can be influenced by policy -- - $\rinactive{t}$ is the _number of deaths / recoveries per active infection per unit time_ at time $t$ - Assumed constant: $\rinactive{t} \equiv 1/10$ -- - A simple evolution model: $$ \active{t + h} - \active{t} \approx h \cdot \active{t} \cdot [ \ractive{t} - \rinactive{t} ] $$ --- - This gives an instantaneous definition of $\ractive{t}$ as <div> \begin{eqnarray*} \ractive{t} &=& \rinactive{t} + \frac{\dactive{t}}{\active{t}} \\ &\approx& \rinactive{t} + \frac{ \active{t + h} - \active{t} }{ h \cdot \active{t} } \end{eqnarray*} </div> - Smallest possible $h = 1$, but we use $h = 7$ to reduce day-of-the-week patterns - NOTE: This is unrealistic because assumes susceptible population _does not decrease_, but - We are only interested in estimating $\lambda(t)$ locally - The goal is to _warn_ when cases are _low_, when this is a mostly reasonable assumption <!-- - Alternative model 1: $$ \confirmed{t + h} - \confirmed{t} \approx h \cdot \active{t} \cdot \rconfirmed{t} $$ - Estimate: $$ \rconfirmed{t} = \frac{ \confirmed{t + h} - \confirmed{t} }{ h \cdot \active{t} } $$ - Alternative model 2 (direct estimate from definition): $$ \frac{\confirmed{t + h} - \confirmed{t}}{\confirmed{t} - \confirmed{t-h}} \approx h \cdot \active{t} \cdot \rincrement{t} $$ - It turns out that $\ractive{t}$ and $\rincrement{t}$ behave similarly, $\rconfirmed{t}$ is a bit different --> --- - Prediction equations: Can take $h = 1$ for prediction <div> \begin{eqnarray*} \active{s} &=& \active{s-h} + h \cdot \active{s-h} \, [ \ractivehat{s-h} - \rinactive{s-h} ] \\ &=& \active{s-h} \left( 1 + h \cdot [ \ractivehat{s-h} - \rinactive{s-h} ] \right) \end{eqnarray*} </div> - Question: How to estimate $\ractive{s-h}$ a function of $h$? --- layout: true # Results --- - Calculations based on data from [covid19india.org](https://covid19india.org) - $\confirmed{t} = \text{ Confirmed (cumulative)}$ - $\active{t} = \confirmed{t} - \text{ Recovered } - \text{ Deceased }$ .center[ [ Updated: 2021-05-14 ] ] --- layout: true # Example: How does $\ractive{t}$ behave for Delhi? ---  ---  --- - Observations: - $\ractive{t}$ is __not__ constant (many infection models assume constant) - Shows periodic stretches of growth and decline - No systematic pattern - Likely combination of biological (variants / vaccination) and social (behaviour) factors - Difficult to predict --- layout: false # Predicting $\ractive{s}$ for future time $s$ - Prediction can be meaningful only for short ranges - We estimate $\ractive{s-h}$ as a linear function of $h$: - Start from the last calculated value on date of prediction - Linear slope estimated from the last two changes - For robustness, we take average over last few values - Start from average of last 4 calculated values of $\ractive{t}$ on date of prediction - Linear slope estimated using linear regression of last 5 estimates -- - Note that - $\ractive{s} > 0.1$ implies active cases will _increase_ over time - $\ractive{s} < 0.1$ implies active cases will _decrease_ over time <!-- - Justification: False alarm better than no alarm --> <!-- - Other models can similarly predict $\active{t}$ - But this seems most stable (TODO: re-check implementations), so only one reported here --> --- layout: true # Example: How soon would this have predicted the Delhi wave? ---  ---  ---  ---  --- - Things to keep in mind: - Predictions can change dramatically over the course of a few days - Long-range predictions should _not_ be taken too seriously (linear growth unrealistic) - More important to track $\ractive{t}$ - However, local trends in $\ractive{t}$ __can__ give early warning - Can indicate upcoming surge - Can detect upcoming peaks (inflection points) - Trends easier to spot than from plot of raw active counts - Should be considered an exploratory summary measure to guide policy / behaviour --- layout: true # Early warning: days till "critical" load --- - A possibly more useful daily summary: number of days to reach critical target - Needs more information: zonewise medical capacity - Proxy for illustration: 0.2% of population (1 in 500 active infections) - E.g., for Delhi, this number is [approximately](https://en.wikipedia.org/wiki/Delhi) $0.002 \times 16,787,941 \approx 34000$ - Number of days is capped at 100 (larger values are plotted as 100) ---  --- - Gives early warning, but also lots of false positives - Alternative is to assume that $\ractive{s}$ remains constant in the short run - More conservative predictions, less false alarms --- layout: true # Conservative prediction using constant $\ractive{t}$ --- 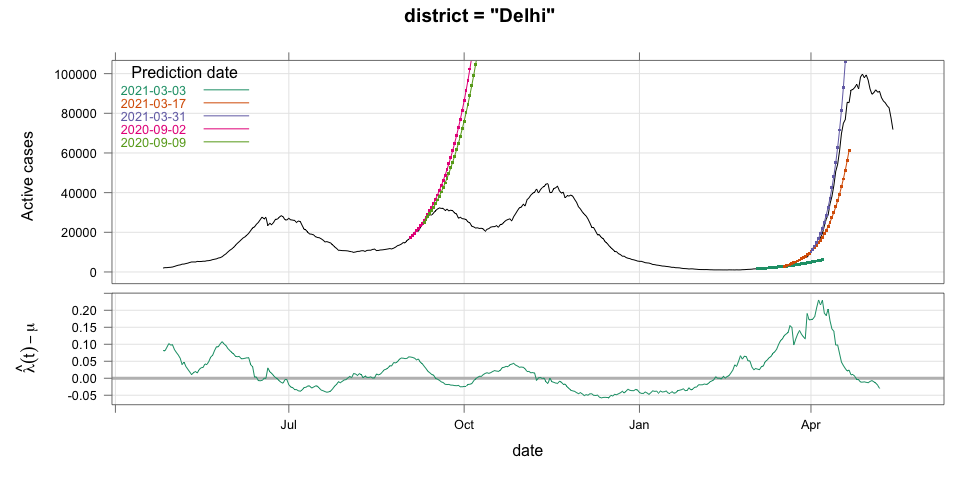 --- 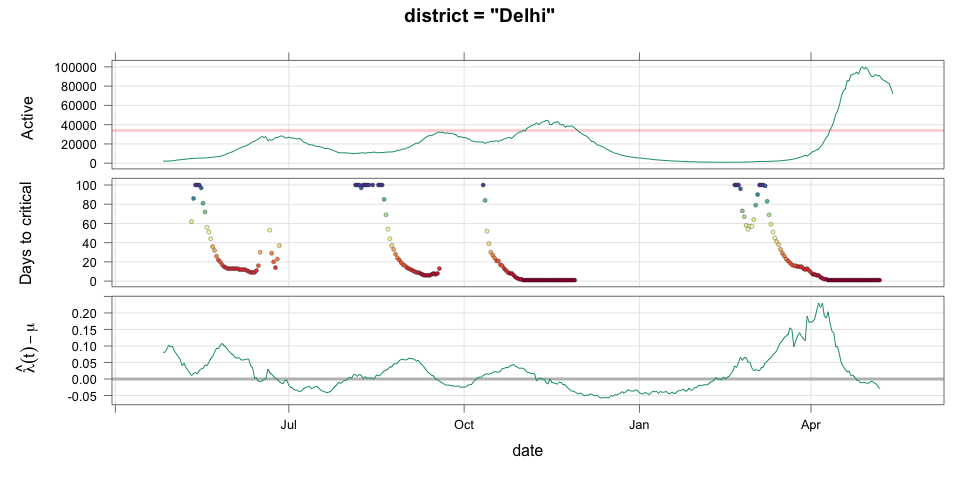 --- class: center, middle layout: false # Similar predictions in other states / districts (number of "days to critical" shown only for major cities) --- 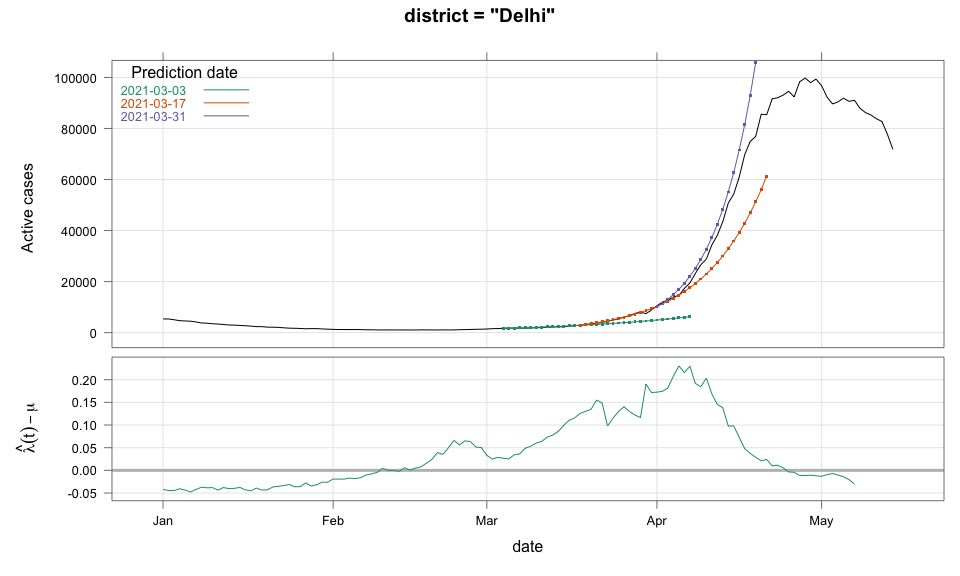 --- 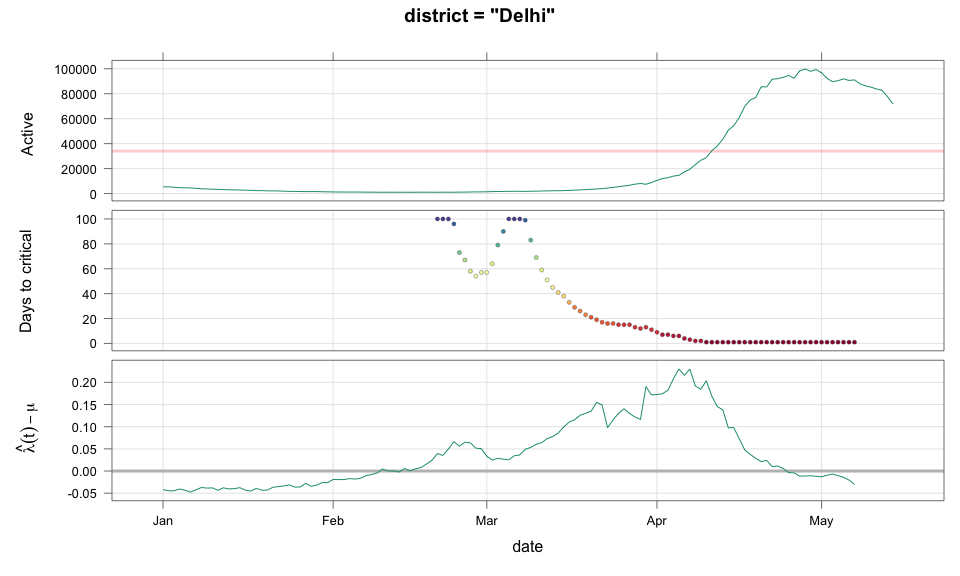 ---  ---  ---  ---  --- 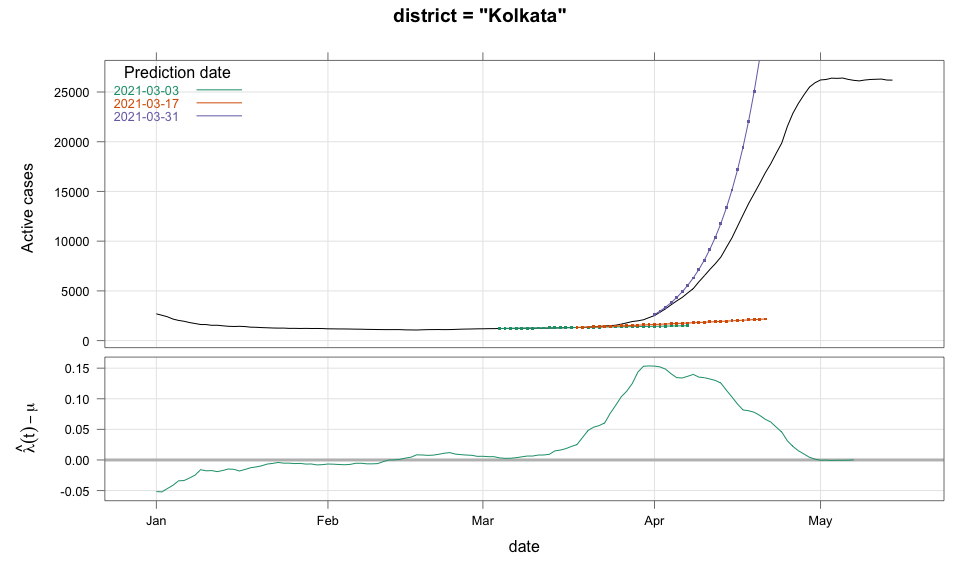 --- 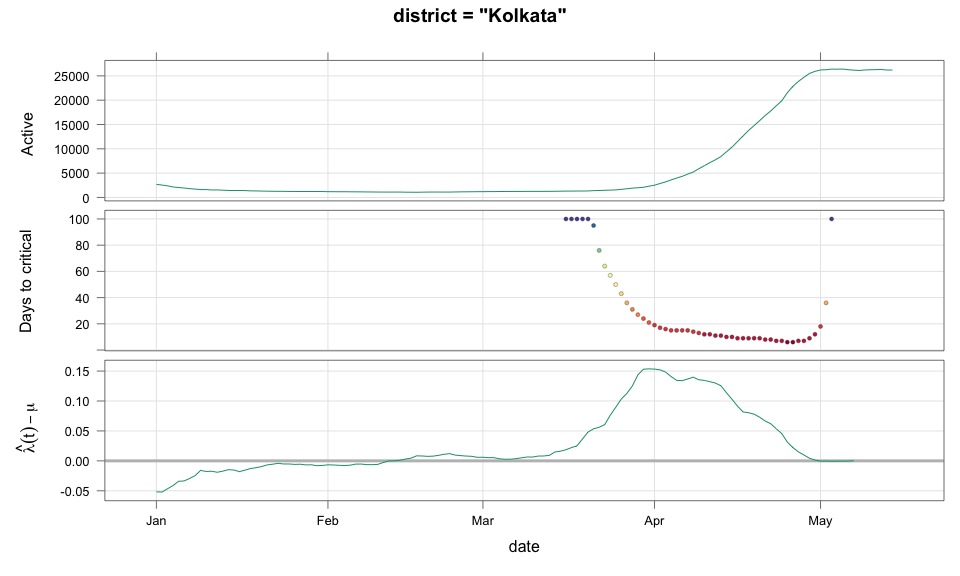 --- 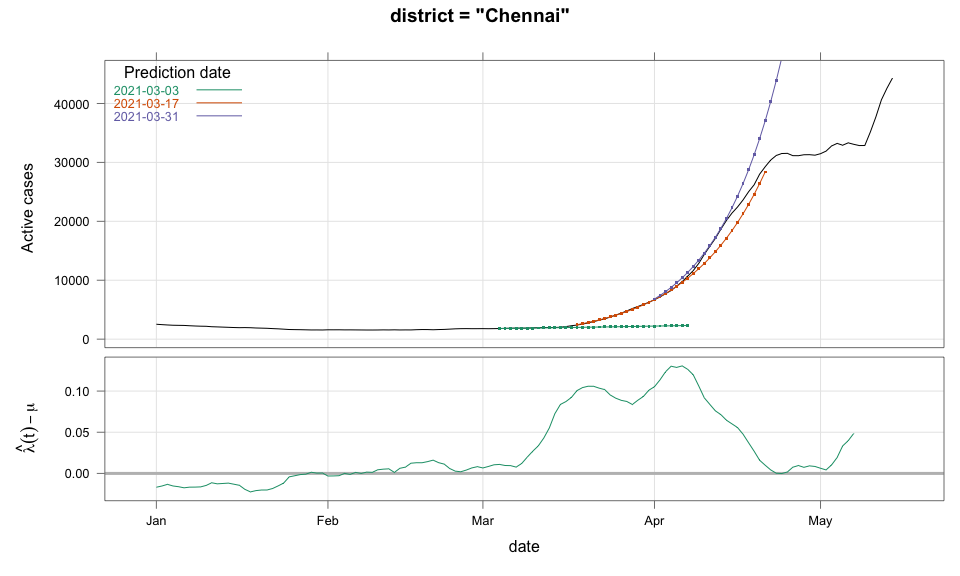 --- 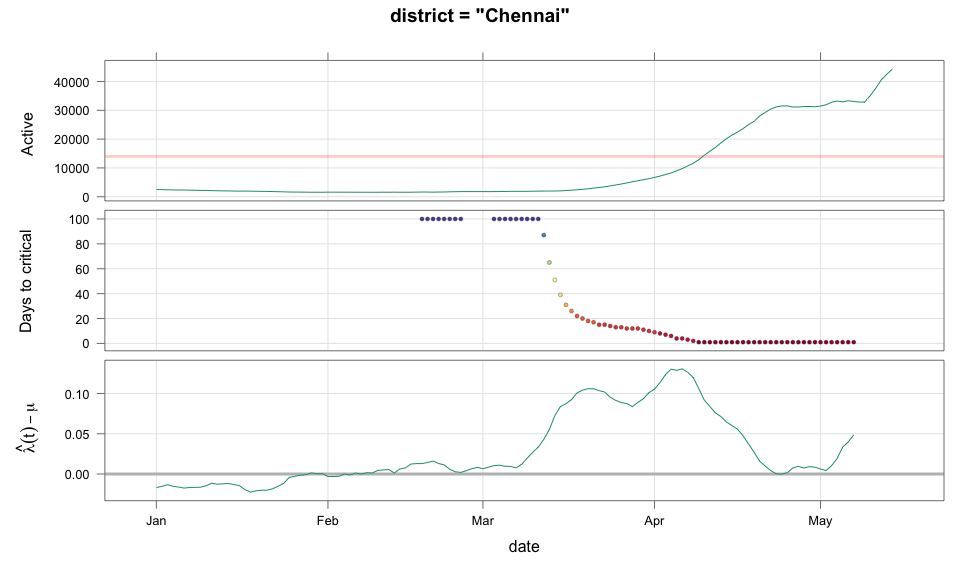 ---  ---  ---  ---  ---  ---  ---  ---  --- 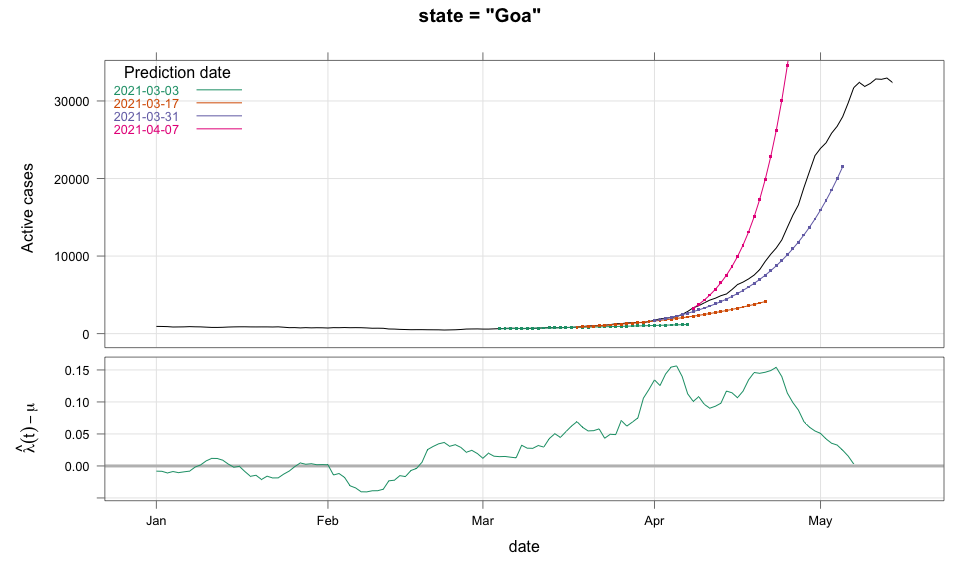 --- 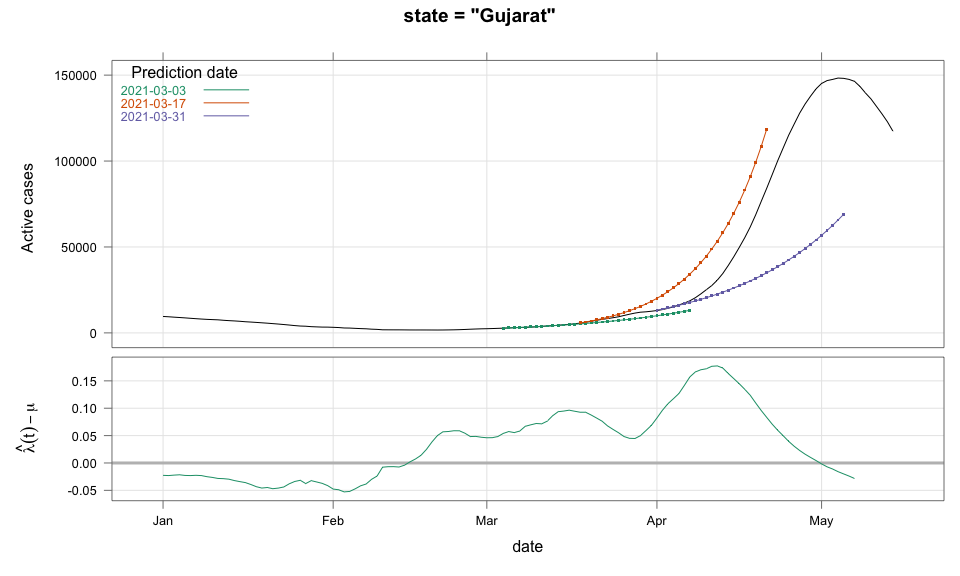 --- 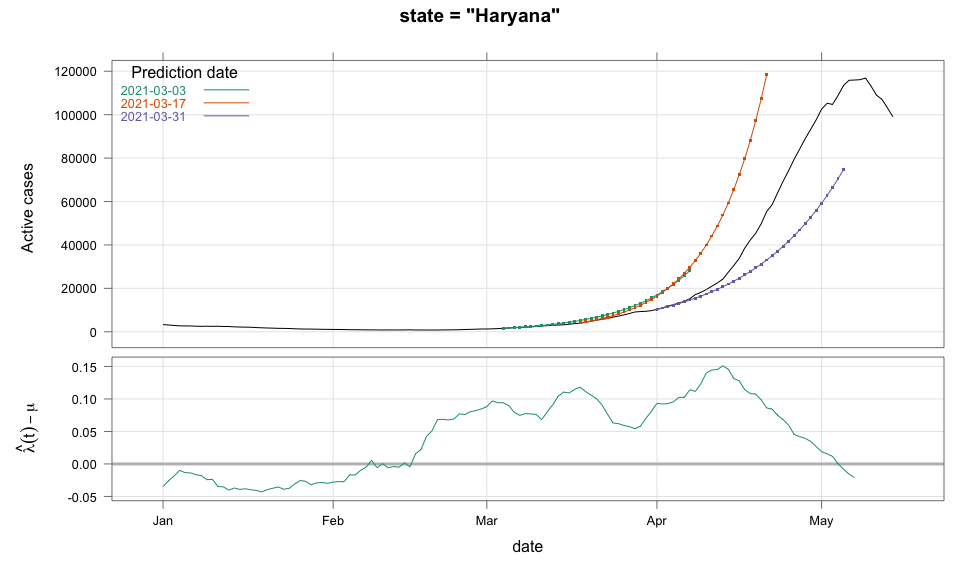 --- 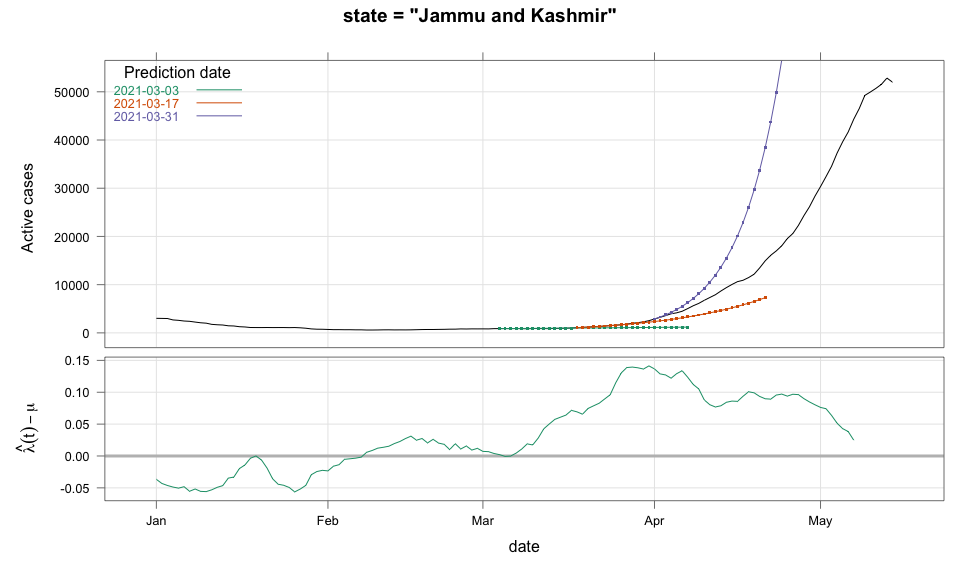 --- 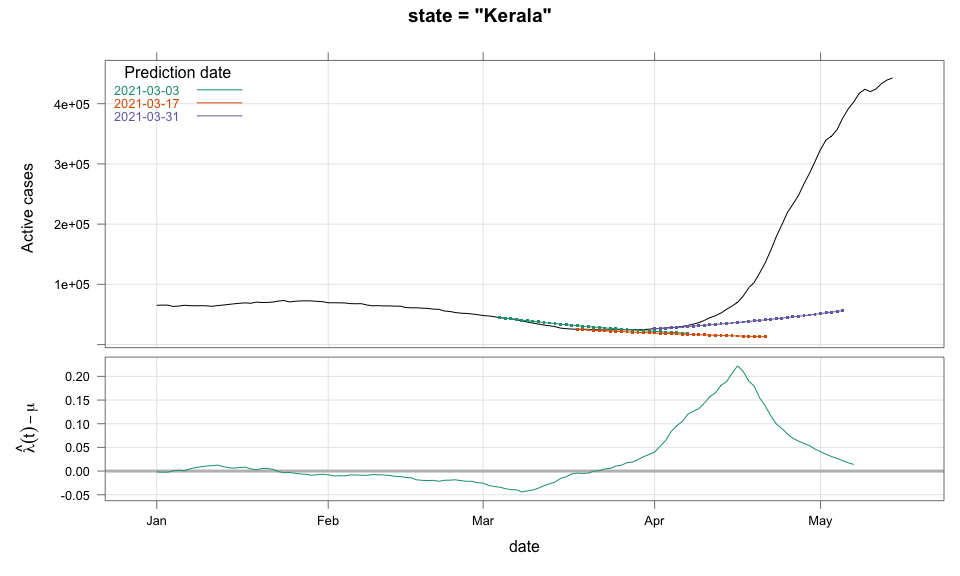 --- 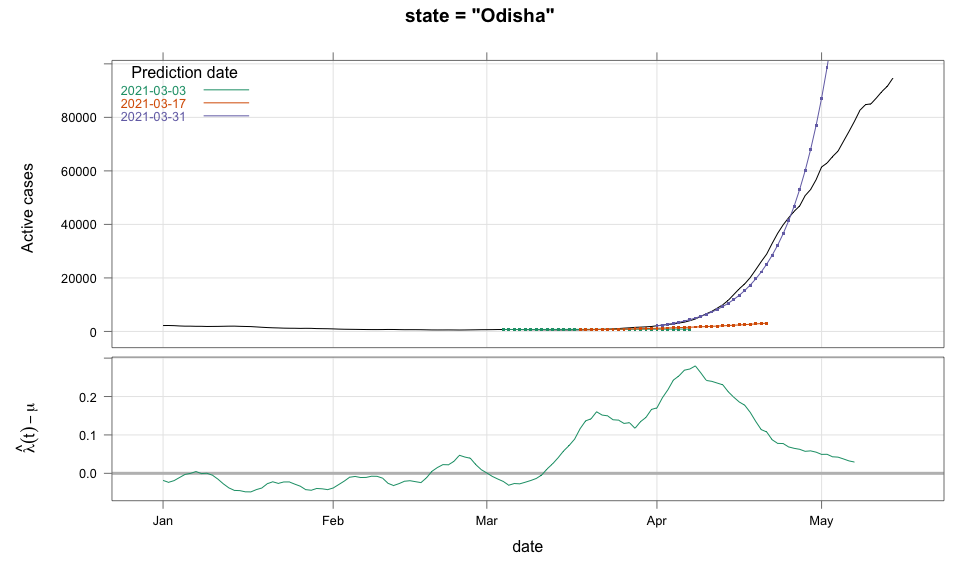 --- 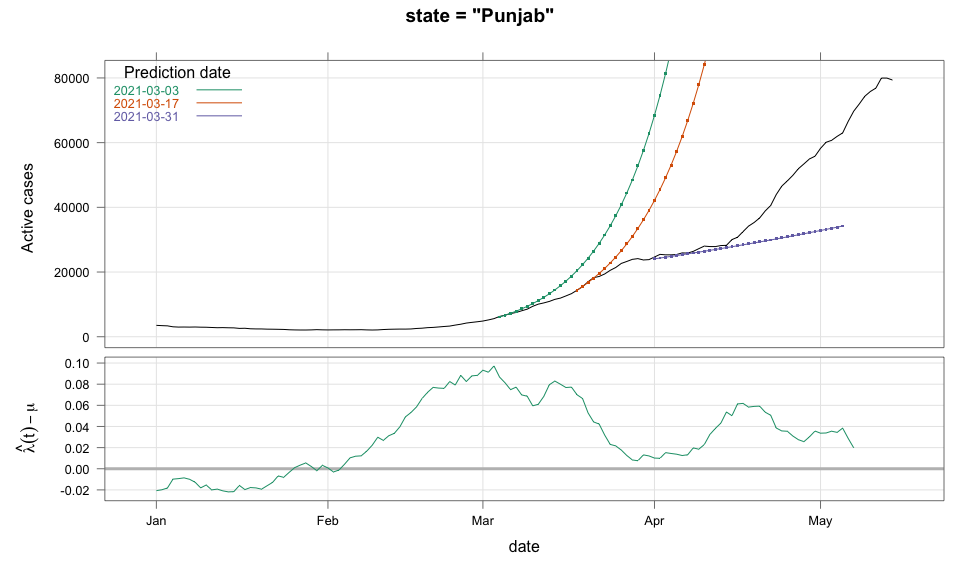 --- 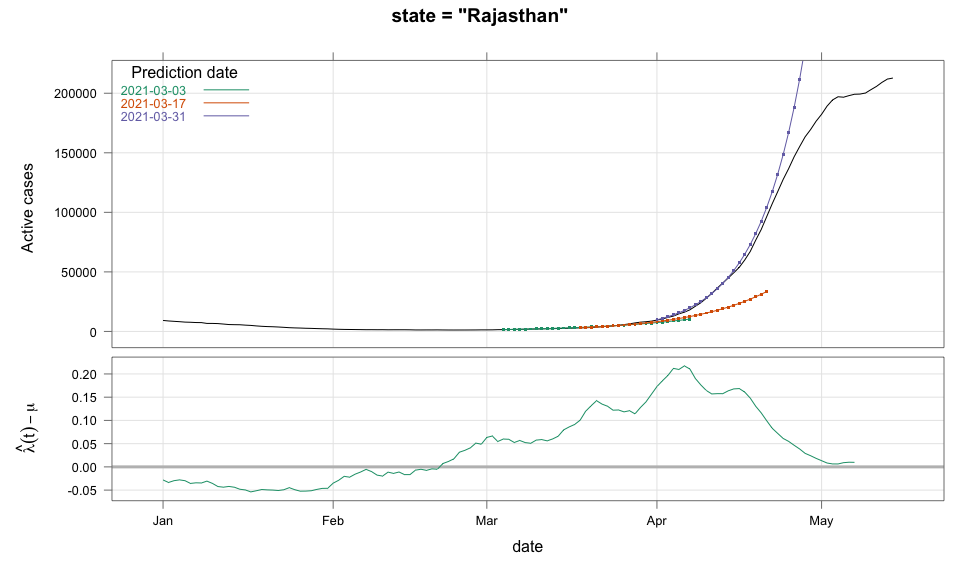 ---  ---  ---  ---