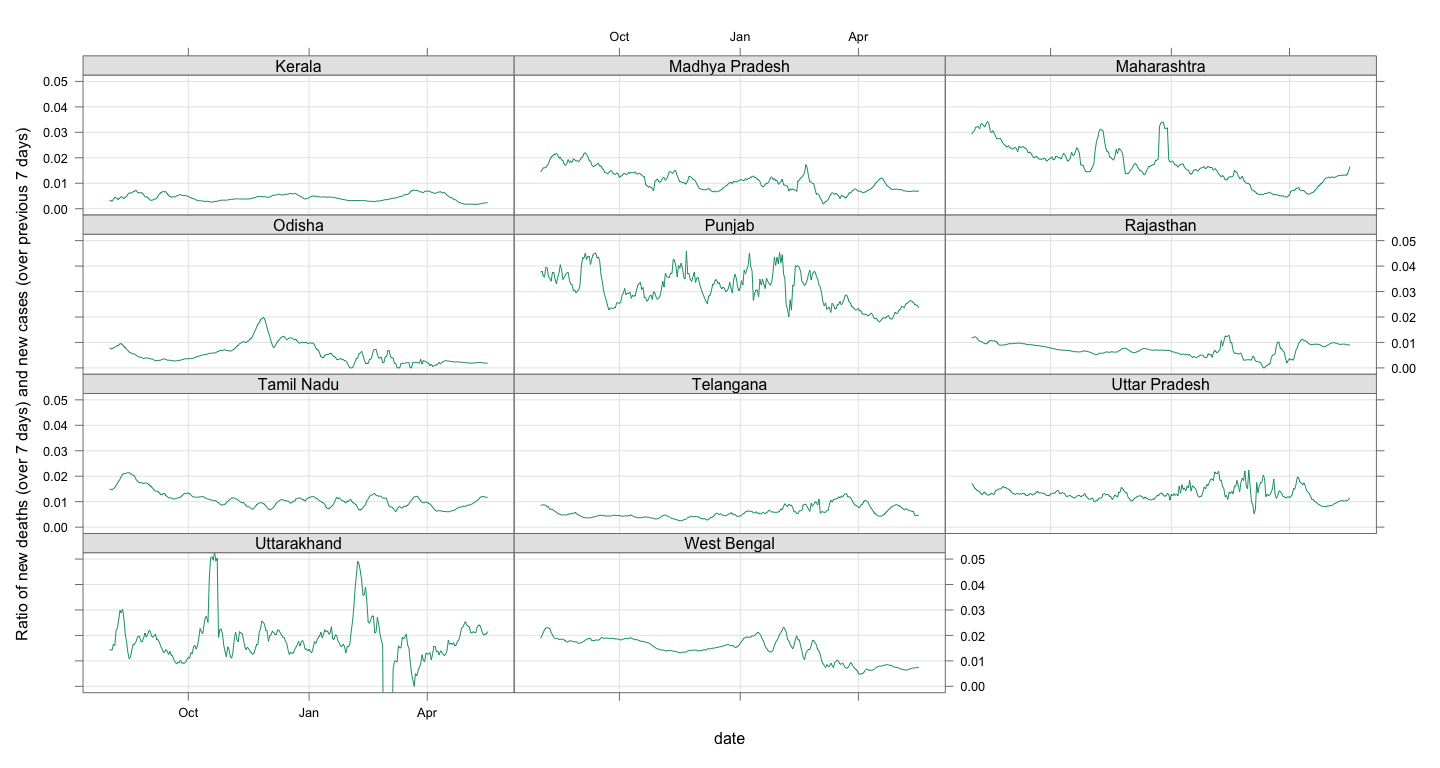
class: center, middle # Measuring How Fast COVID Infections are Spreading in India ### Deepayan Sarkar <h1 onclick="document.documentElement.requestFullscreen();" style="cursor: pointer;"> <svg xmlns="http://www.w3.org/2000/svg" width="16" height="16" fill="currentColor" class="bi bi-arrows-fullscreen" viewBox="0 0 16 16"> <path fill-rule="evenodd" d="M5.828 10.172a.5.5 0 0 0-.707 0l-4.096 4.096V11.5a.5.5 0 0 0-1 0v3.975a.5.5 0 0 0 .5.5H4.5a.5.5 0 0 0 0-1H1.732l4.096-4.096a.5.5 0 0 0 0-.707zm4.344 0a.5.5 0 0 1 .707 0l4.096 4.096V11.5a.5.5 0 1 1 1 0v3.975a.5.5 0 0 1-.5.5H11.5a.5.5 0 0 1 0-1h2.768l-4.096-4.096a.5.5 0 0 1 0-.707zm0-4.344a.5.5 0 0 0 .707 0l4.096-4.096V4.5a.5.5 0 1 0 1 0V.525a.5.5 0 0 0-.5-.5H11.5a.5.5 0 0 0 0 1h2.768l-4.096 4.096a.5.5 0 0 0 0 .707zm-4.344 0a.5.5 0 0 1-.707 0L1.025 1.732V4.5a.5.5 0 0 1-1 0V.525a.5.5 0 0 1 .5-.5H4.5a.5.5 0 0 1 0 1H1.732l4.096 4.096a.5.5 0 0 1 0 .707z"/> </svg> </h1> --- # Background * Trying to measure growth rate rather than absolute number of cases * The usual motivations: - Want something that can be compared across time and location - Something that should not depend on degree of systematic under-reporting - Something that should not be overly affected by daily fluctuations and patterns * Measure used: number of new cases in _last seven days_ divided by number in _previous seven days_ * Anything higher than 1 is bad on a sustained basis, but more than 2 is _really_ bad .center[ [ Updated: 2021-05-17 ] ] --- # Cities: Bengaluru, Chennai, Delhi, Kolkata, Mumbai 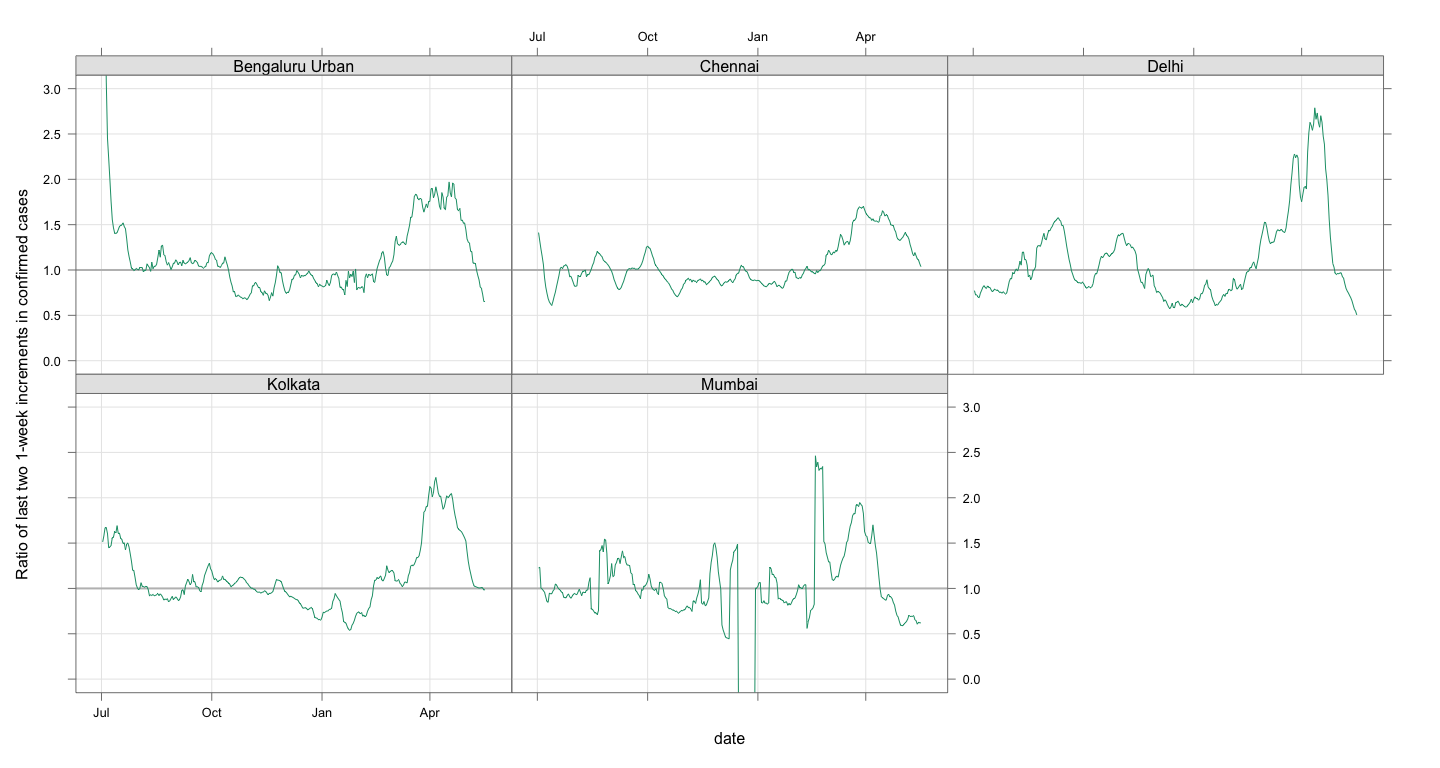 --- # States: Delhi, Karnataka, Maharashtra, West Bengal 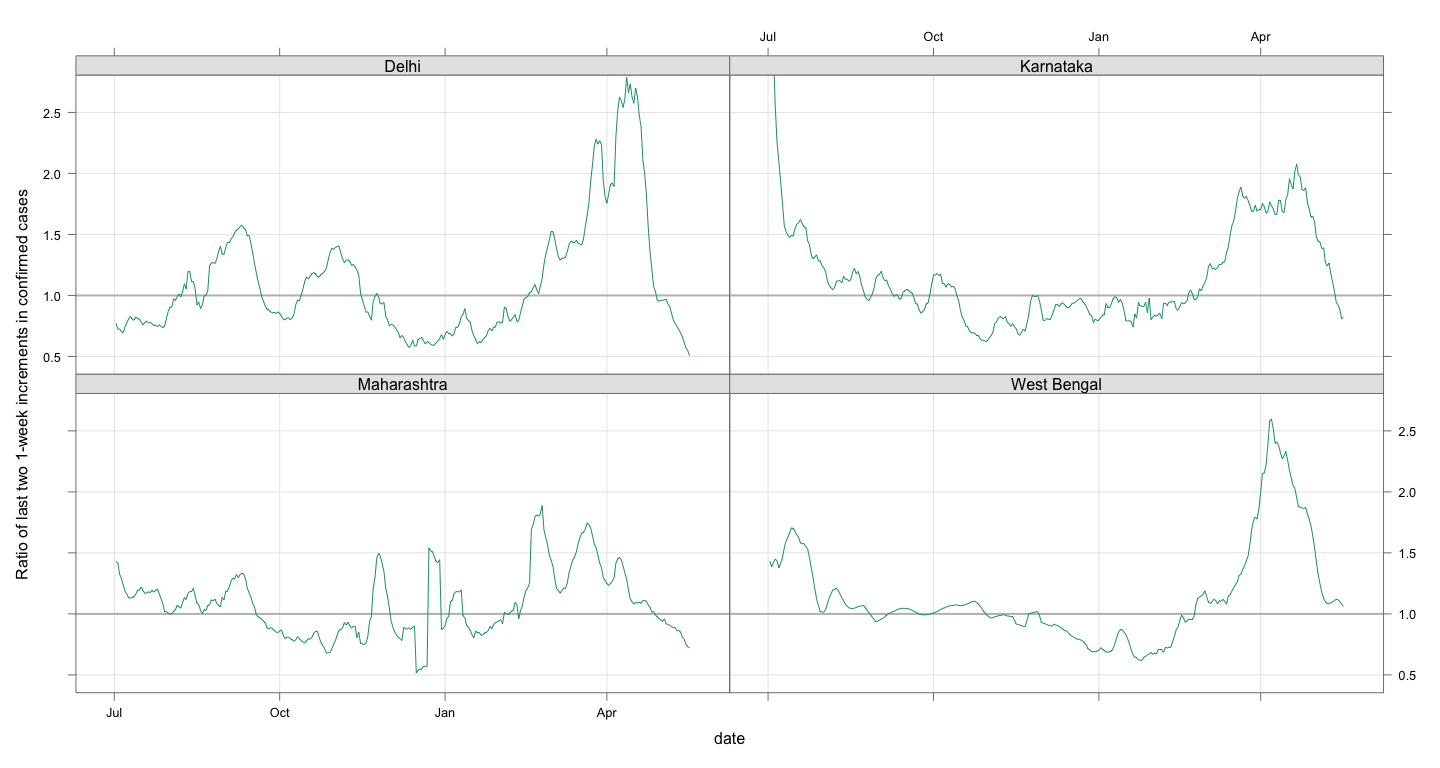 --- # Current growth rates by state .scrollable500[ | | Current Rate| Rate One week ago| Cases in last 7 days| Cases in previous 7 days| |:----------------------------------------|------------:|-----------------:|--------------------:|------------------------:| |Karnataka | 0.82| 1.18| 268382| 327380| |Maharashtra | 0.72| 0.86| 266095| 367951| |Kerala | 0.90| 1.12| 239254| 265326| |Tamil Nadu | 1.23| 1.39| 222054| 181173| |Andhra Pradesh | 1.09| 1.15| 151463| 138595| |West Bengal | 1.06| 1.09| 139829| 131710| |Uttar Pradesh | 0.57| 0.82| 104223| 182354| |Rajasthan | 0.80| 1.01| 98072| 121947| |Odisha | 1.07| 1.28| 78108| 73337| |Haryana | 0.73| 1.10| 73300| 100842| |Gujarat | 0.79| 0.88| 67150| 85182| |Delhi | 0.50| 0.75| 62173| 123229| |Bihar | 0.61| 0.99| 56179| 92603| |Madhya Pradesh | 0.69| 0.92| 55828| 81048| |Chhattisgarh | 0.61| 0.88| 55711| 91642| |Punjab | 0.92| 1.26| 53912| 58632| |Uttarakhand | 0.78| 1.31| 41191| 52791| |Assam | 1.06| 1.52| 36852| 34721| |Telangana | 0.67| 0.84| 30597| 45702| |Himachal Pradesh | 0.98| 1.60| 28004| 28661| |Jammu and Kashmir | 0.82| 1.37| 27406| 33327| |Jharkhand | 0.62| 0.93| 25479| 41159| |Goa | 0.67| 1.29| 15768| 23562| |Puducherry | 1.20| 1.33| 12977| 10815| |Chandigarh | 0.84| 1.03| 4917| 5874| |Manipur | 1.32| 1.66| 4281| 3255| |Meghalaya | 1.56| 1.58| 3837| 2454| |Tripura | 1.76| 1.80| 3459| 1969| |Nagaland | 1.13| 1.51| 2066| 1832| |Arunachal Pradesh | 1.23| 1.19| 1736| 1412| |Sikkim | 1.07| 1.28| 1556| 1456| |Mizoram | 0.95| 1.33| 1206| 1265| |Ladakh | 1.04| 1.37| 1153| 1114| |Lakshadweep | 1.11| 1.08| 1004| 902| |Dadra and Nagar Haveli and Daman and Diu | 0.64| 0.72| 601| 936| |Andaman and Nicobar Islands | 0.97| 0.57| 240| 248| ] --- layout: true # All other states with at least 100000 confirmed cases --- 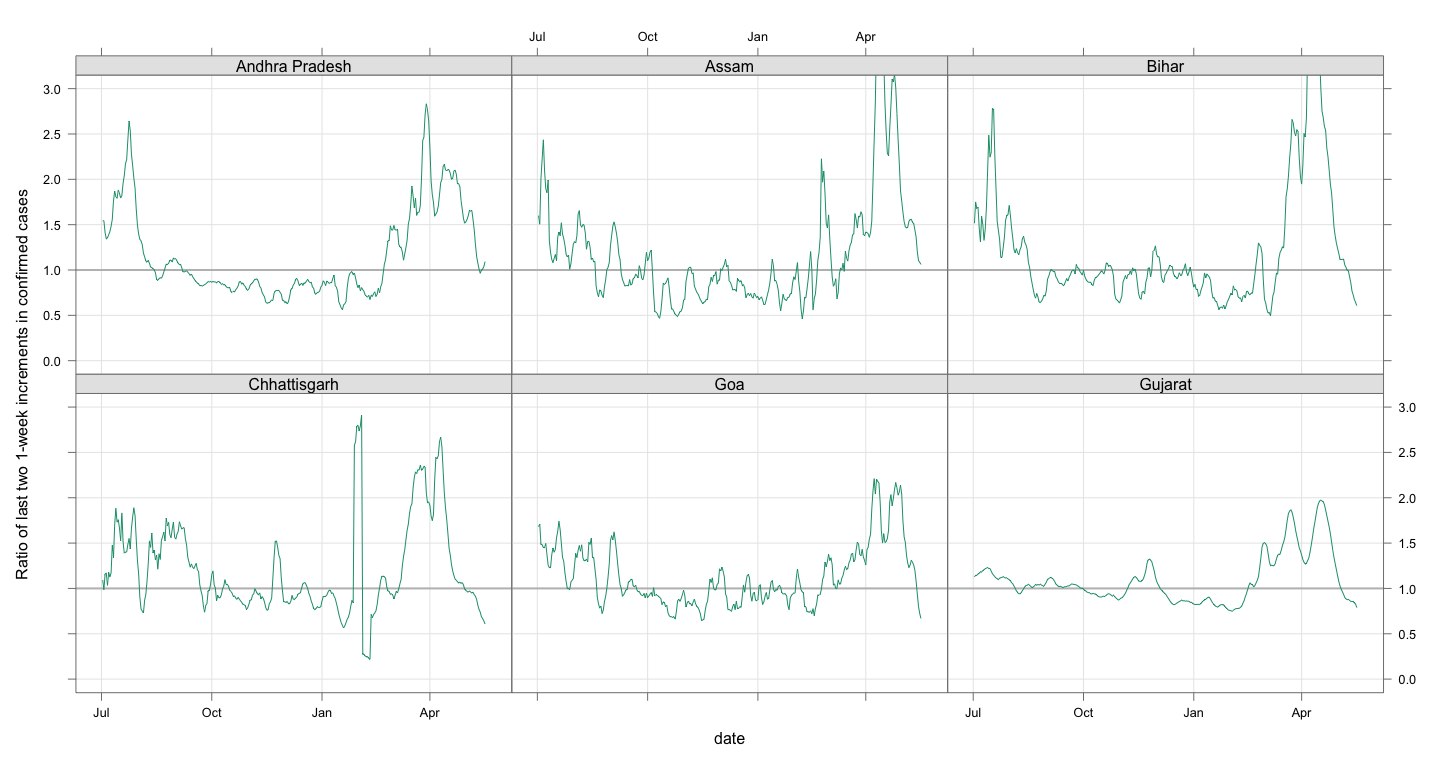 --- 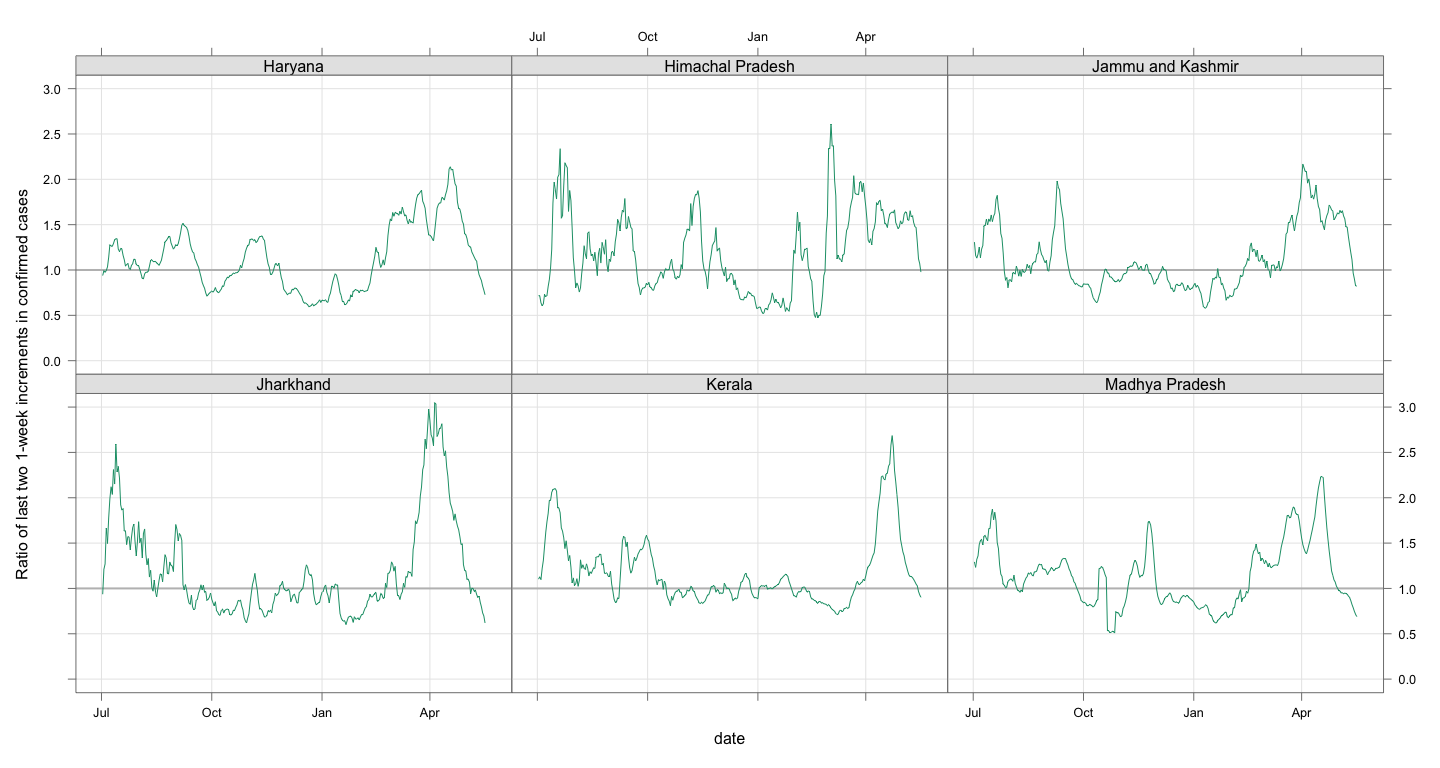 --- 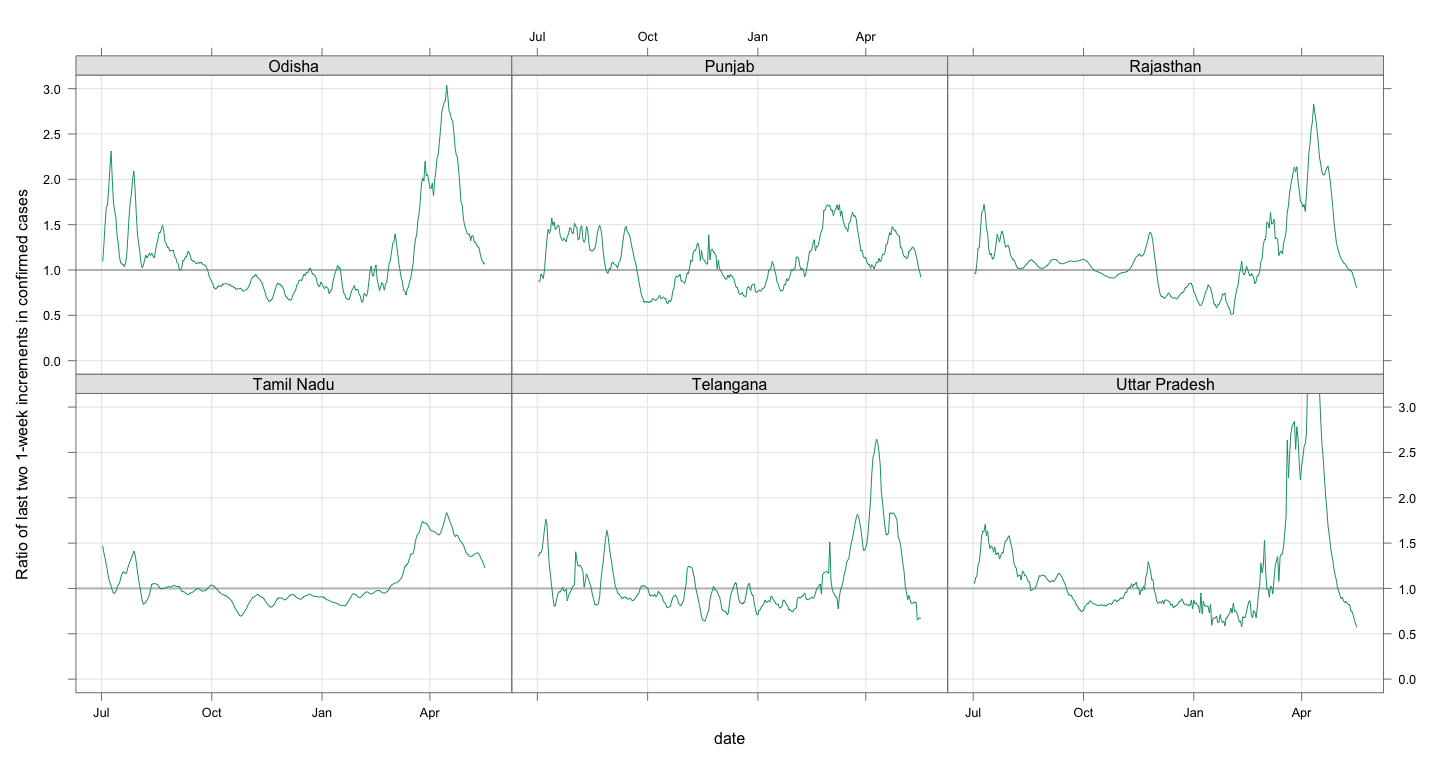 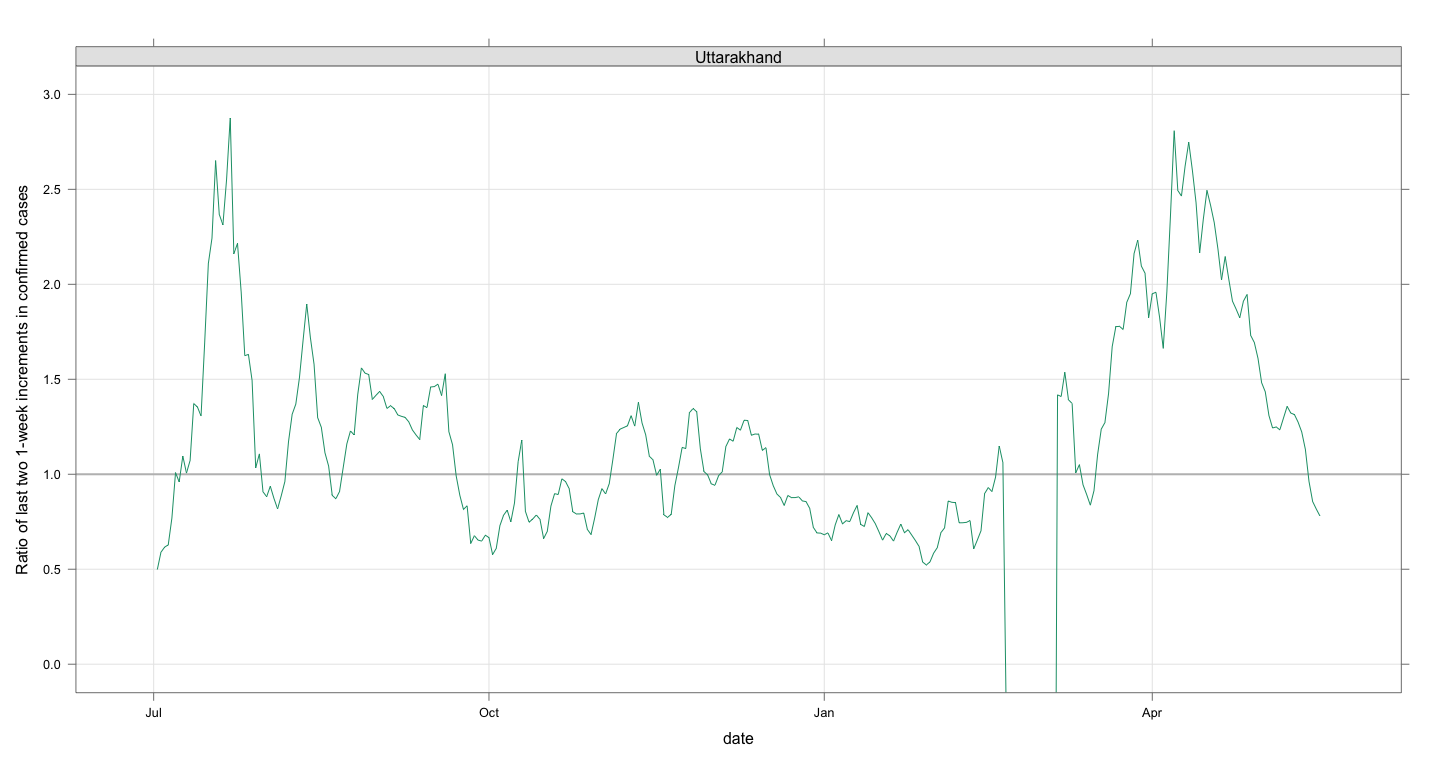 --- layout: false # All election states have seen a surge 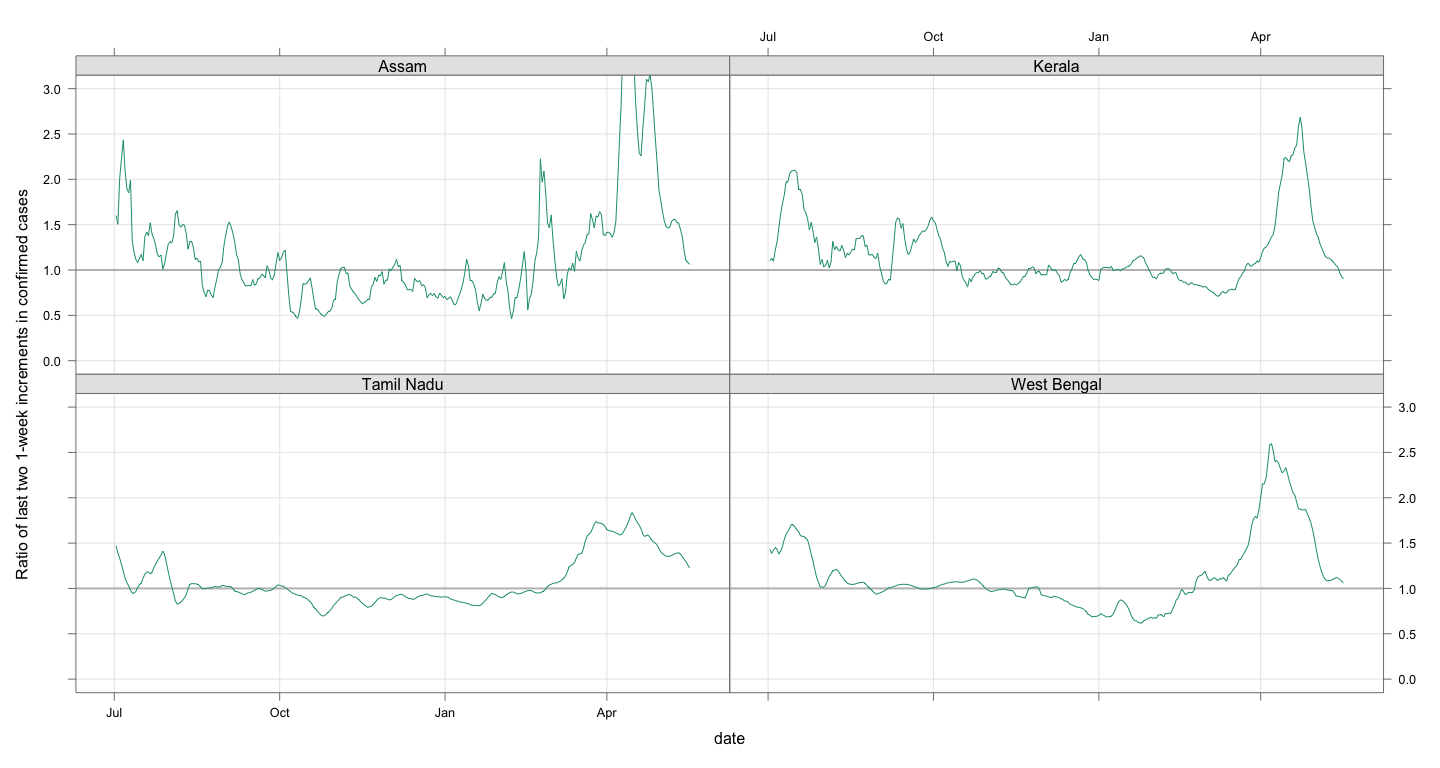 --- # Urban vs Rural - In many states, COVID numbers were dominated by urban areas - Has the pattern of growth been similar in urban vs rural? - Has the pattern changed, especially due to the elections in March and April? - In the following plots, "urban" districts are those within a state that cumulatively accounted for more than 50% of cases till March 1 --- # West Bengal 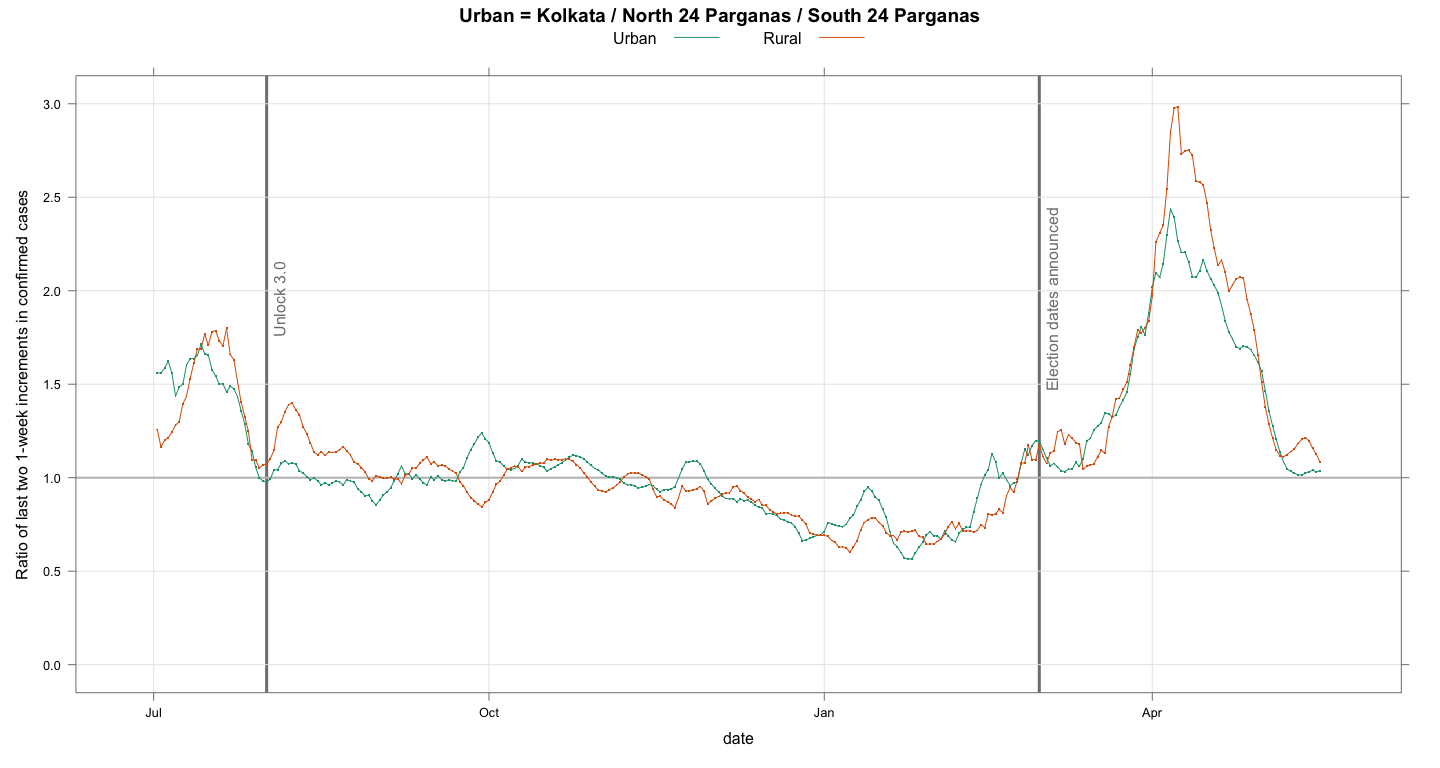 --- # Tamil Nadu 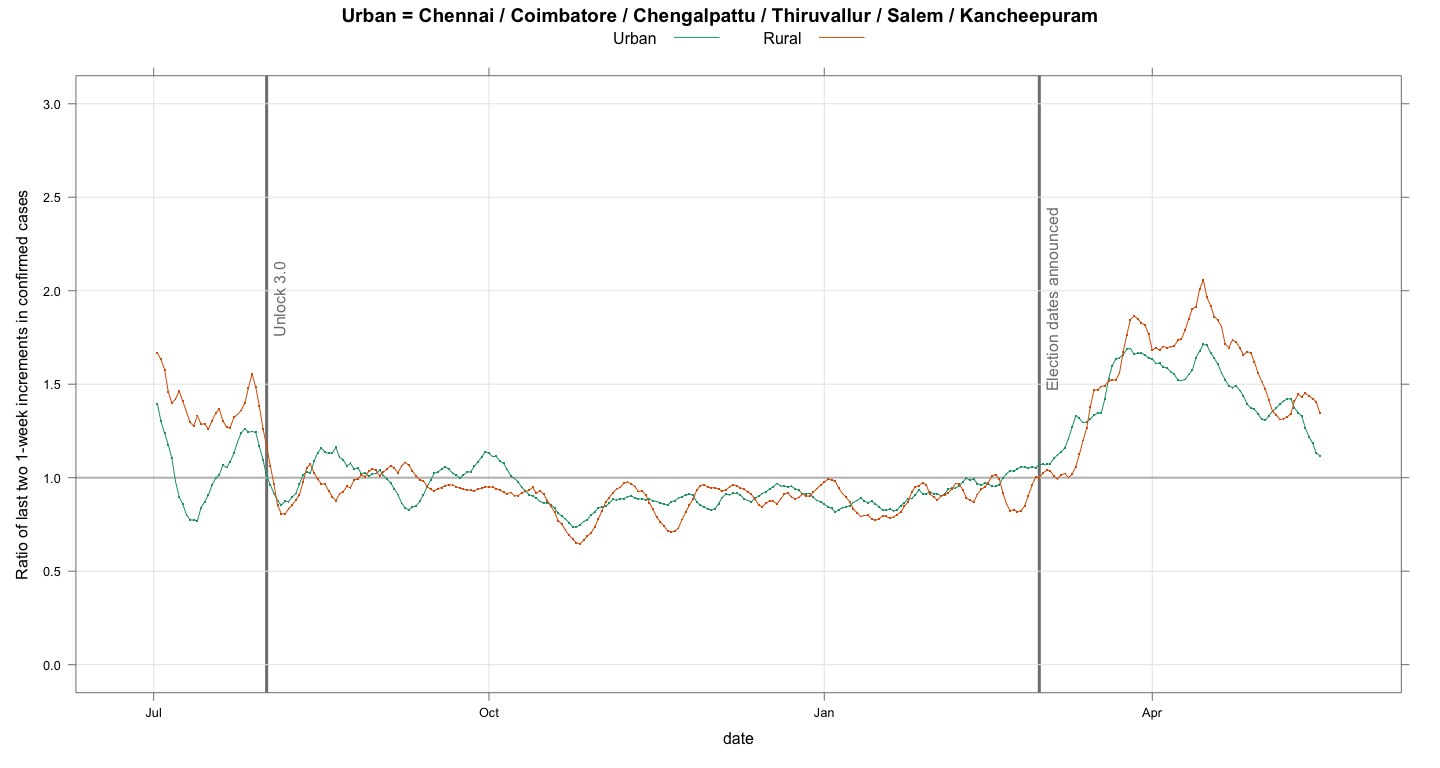 --- # Kerala 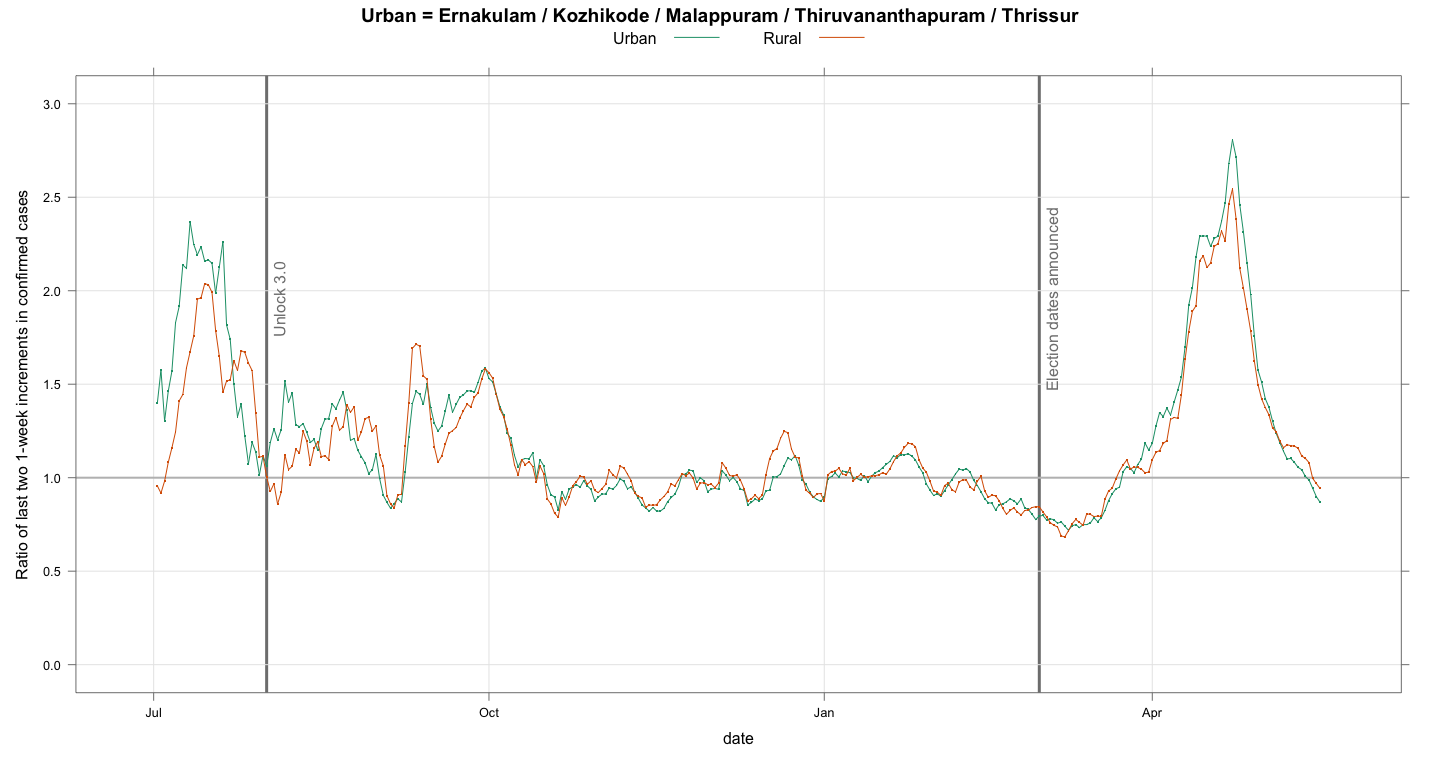 --- # Maharashtra 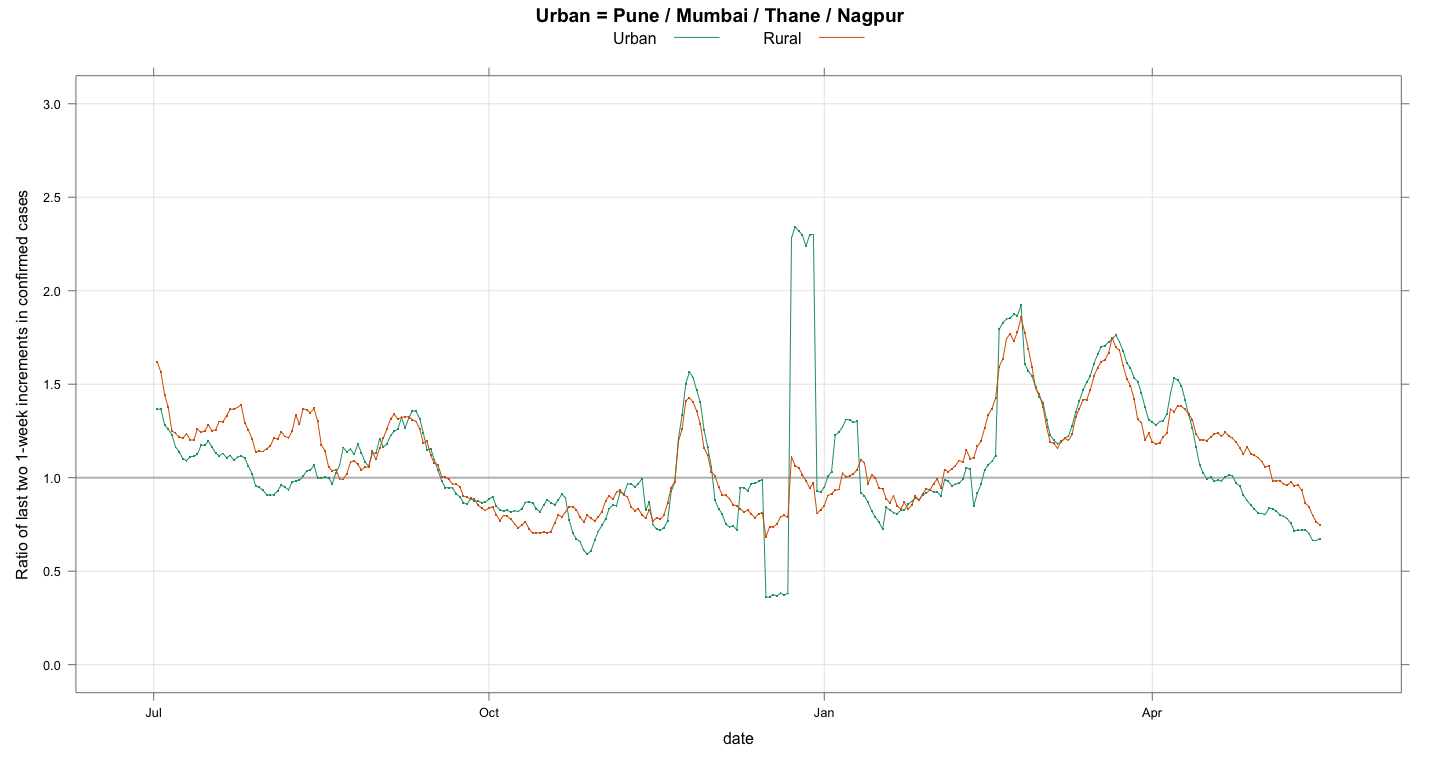 --- # Karnataka 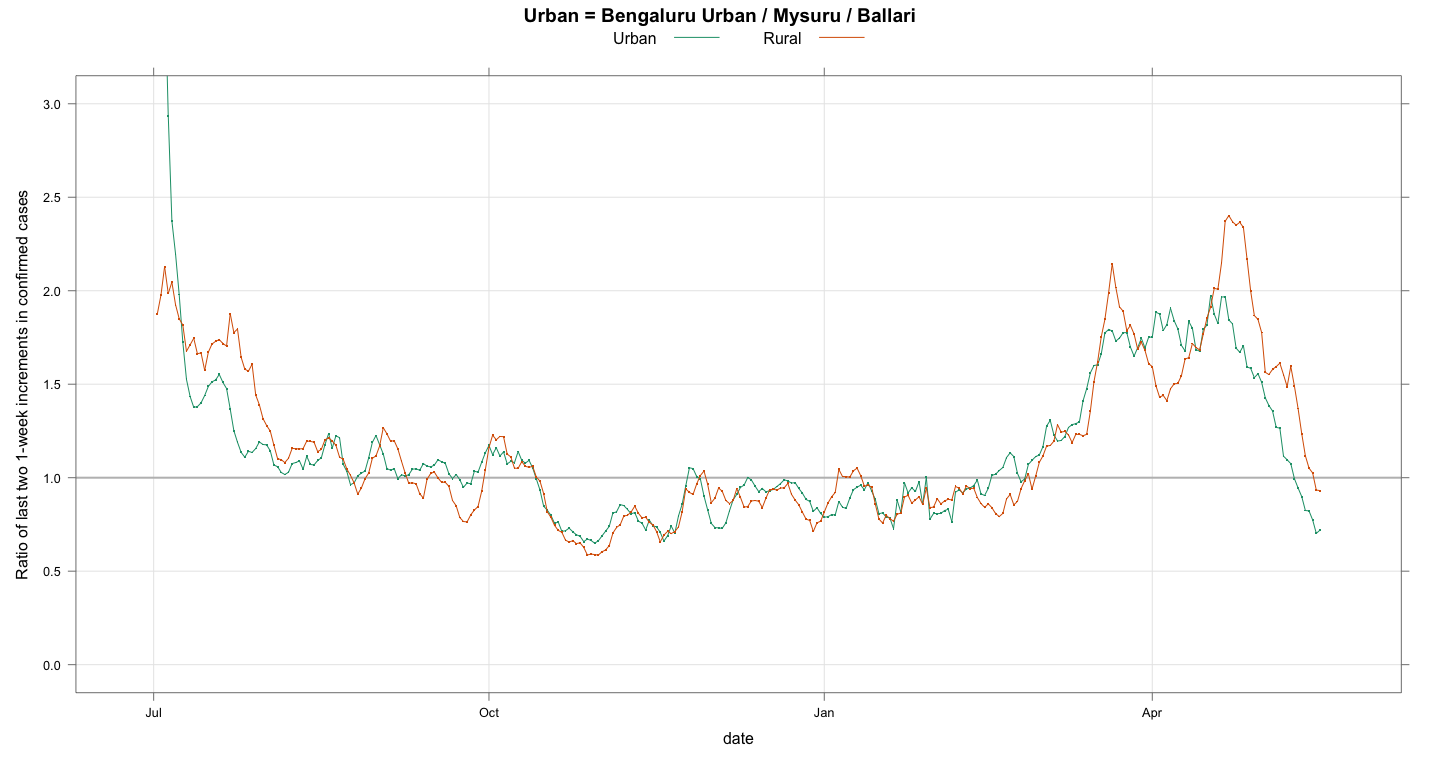 --- # Data quality: estimating death rate - Kerala and Karnataka seem not to have controlled their growth - In contrast, most North Indian states seem to be "improving" despite no obvious explanation - Could this be due to under-reporting, whether due to strain on testing infrastructure or other reasons? - One way to indirectly check this is to look at deaths vs cases - The premise is that deaths will be reported more reliably than cases - To account for lag, we compare new deaths in a 7-day window with new cases in the previous 7-day window - Unfortunately, this only shows that data quality has been inconsistent throughout in most states --- layout: true # Death rate (with 7-day lag) --- 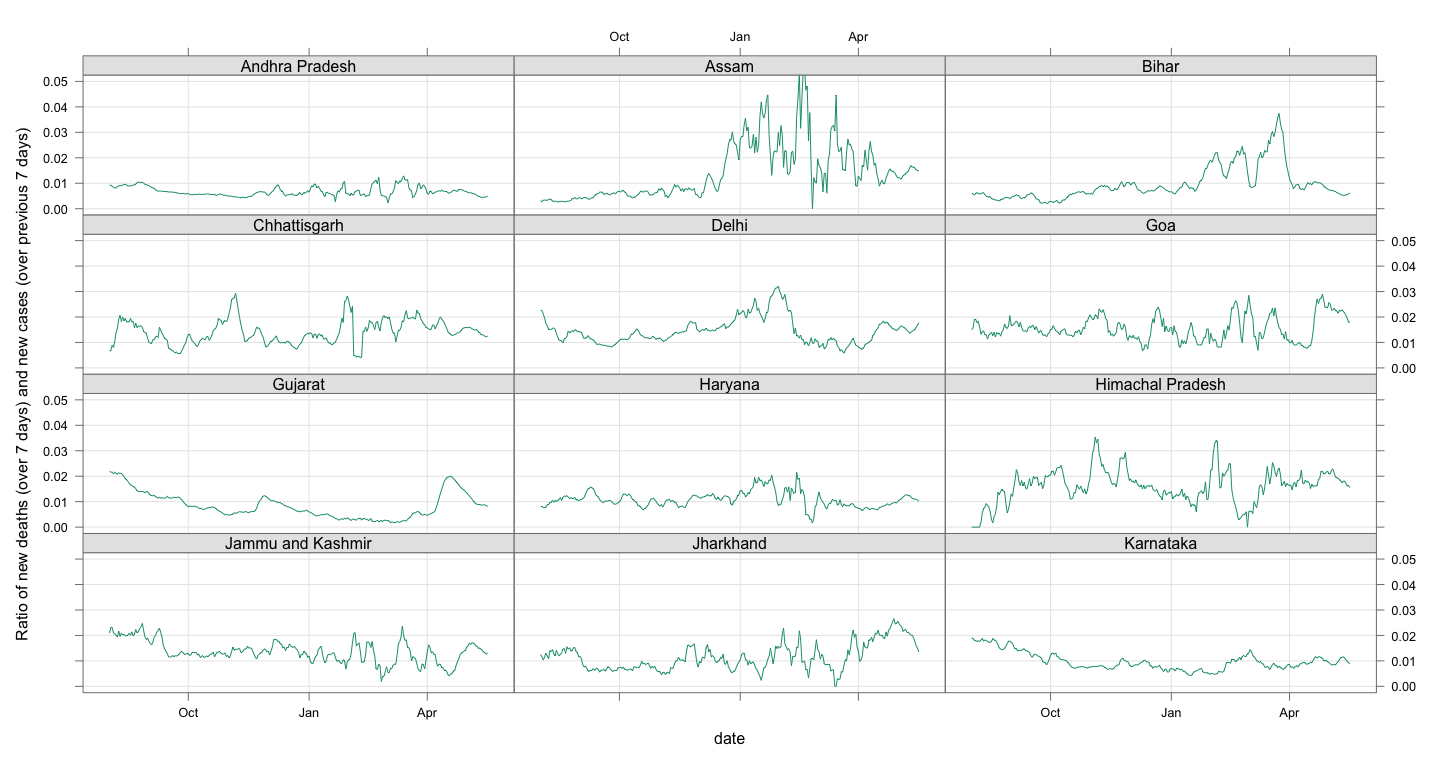 ---